
Introduction
Arc Energy calculation is specified in ISO/TR 18491 for most ISO welding standards.
There are 3 equations quoted for calculating arc energy:
Where the symbols are:
| Abbreviations and symbols | Term | Unit |
| I | Arc welding current | A |
| L | Length of run | mm |
| U | Arc voltage | V |
| v | Travel speed | mm/s |
| E | Arc Energy | kJ/mm |
| IE | Instantaneous energy | J |
| IP | Instantaneous Power | J/s |
Table 1 Symbols of Terms used (ISO/TR 18491:2015(E))
ISO/TR 18491 specifies the arc energy calculation. To change arc energy to heat input the arc energy is multiplied by the process efficiency.
The equations 2 and 3 are essentially the same and are measuring instantaneous power. Equation 1 is more of the traditional approach and is using average value of voltage and current.
According to ISO/TR 18491 all 3 equations are permitted for power sources that do not employ direct electronic control of the waveform, noted as “non-waveform controlled” power sources. If the welding process is a controlled waveform power source equations 2 or 3 must be used. This means using a meter capable of monitoring voltage and current simultaneously to determine the instantaneous energy or power.
A waveform controlled power sources is defined as:
“All pulsed welding processes, for example, pulsed gas metal arc welding, are waveform-controlled welding processes. Power sources that are sold as synergic, programmable, or microprocessor-controlled are generally capable of waveform-controlled welding.”
The differences can be very high between the calculation methodologies. These are some examples.
TIG power source Arc Energy Calculation
DC TIG
DC TIG is probably the simplest waveform to deal with electronically. This is a typical 0.1 second sample.
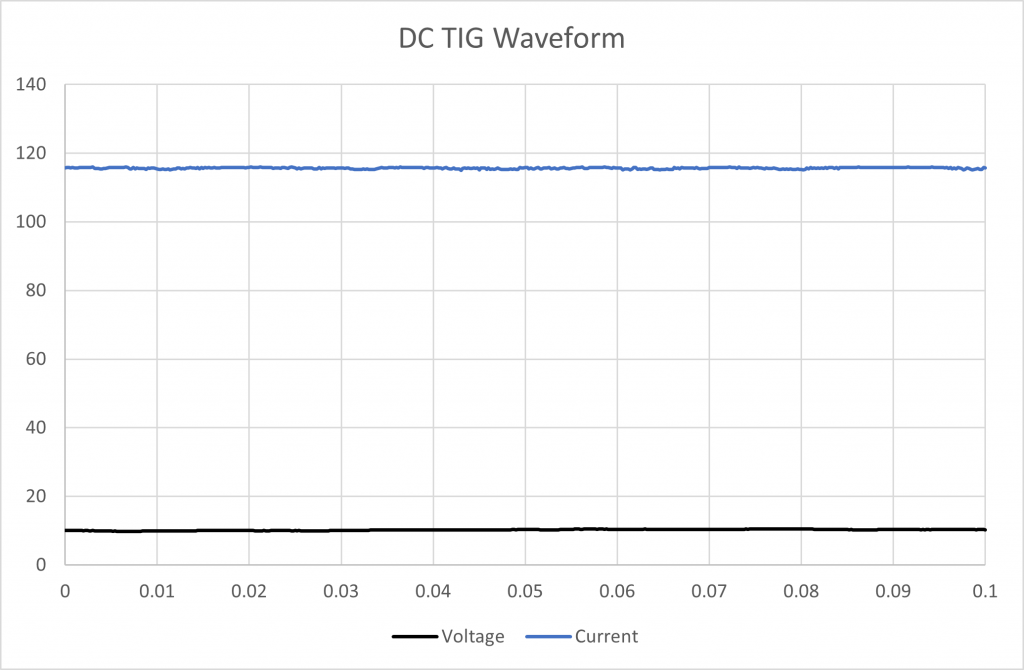
Figure 1 DC TIG Waveform (0.1 second)
Not surprisingly both calculation methods give the same result.
Method 1.
Average current: 115.6 A
Average voltage: 10.2 V
Say the welding is performed at 120 mm/min (2mm/s). Equation 1 is:
E = 0.590 kJ/mm
Method 2 and 3.
Instantaneous power is the average of every measurement of U x every measurement of I.
Taking the first few data points:
| Voltage (V) | Current (I) | Energy (UxI) (J) | |
| 10.12 | 115.66 | 1170.96 | |
| 10.07 | 115.79 | 1166.26 | |
| 10.07 | 115.79 | 1166.26 | |
| 10.03 | 115.66 | 1160.44 | |
| 10.05 | 115.79 | 1163.25 | |
| 10.05 | 115.66 | 1161.95 | |
| 10.05 | 115.66 | 1161.95 | |
| 10.05 | 115.66 | 1161.95 | |
| 10.06 | 115.92 | 1166.05 | |
| 10.03 | 115.92 | 1163.04 | |
| 10.02 | 115.92 | 1161.54 | |
| 10.05 | 115.92 | 1164.55 |
Then averaging the Energy column gives the average instantaneous power J/s. In this case 1184.67 J/s. Hence equation 3 becomes:
E = 0.592 kJ/mm
Both methods give the same answer within 1%.
Pulse TIG
Under ISO/TR 18491 it could be argues that pulse TIG is a controlled waveform power source.
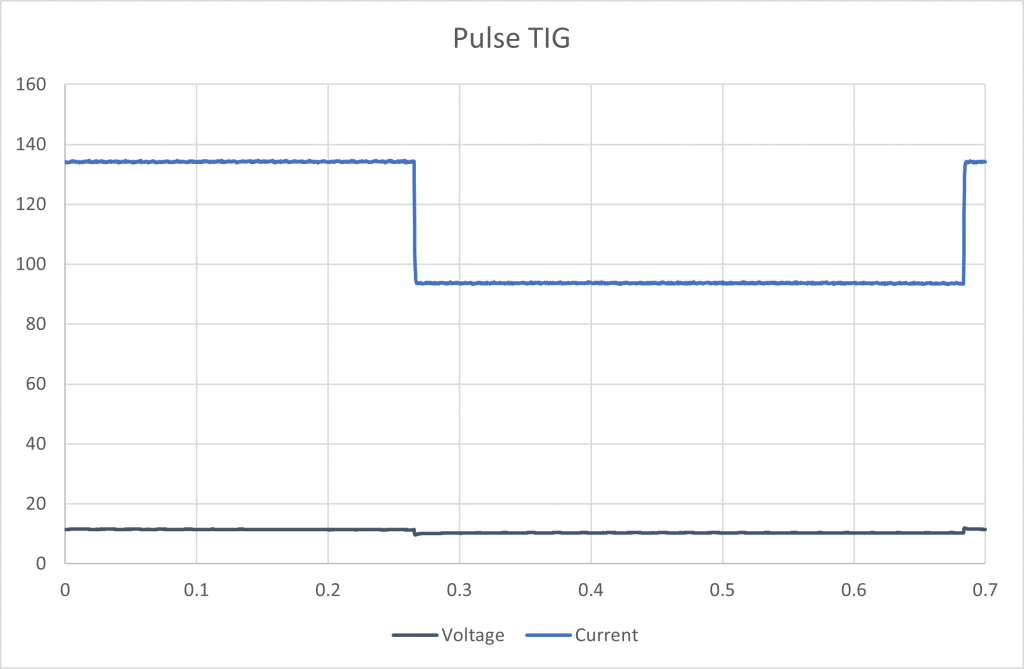
Figure 2 Pulse TIG Waveform (0.7 second)
The waveform is still very clean, and the voltage only changes slightly as the current pulse comes on and off.
Method 1.
Average current: 111.7 A
Average voltage: 10.8 V
Say the welding is performed at 120 mm/min (2mm/s). Equation 1 is:
E = 0.603 kJ/mm
Method 2 and 3.
PI = 1210.73
E = 0.605 kJ/mm
Difference less than 1% in this case.
MIG Power Source Arc Energy Calculation
Spray transfer MIG welding
Spray transfer MIG is closest to DC TIG, but not such a clean waveform.
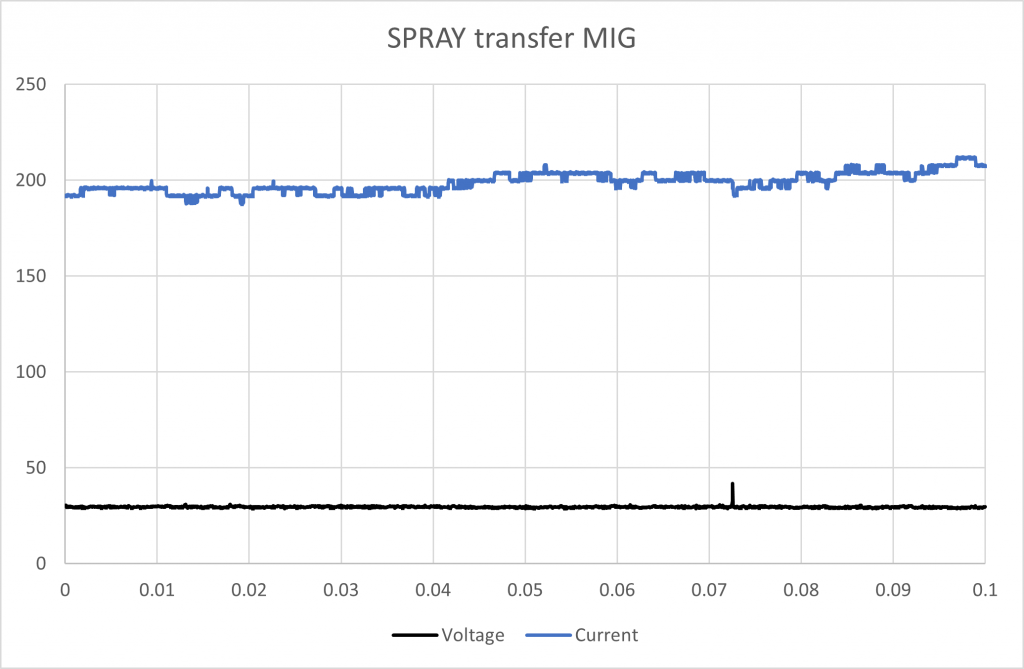
Figure 3 SPRAY transfer MIG 0.1 second
Method 1.
Average current: 199.0 A
Average voltage: 29.7 V
Say the welding is performed at 120 mm/min (2mm/s). Equation 1 is:
E = 2.955 kJ/mm
Method 2 and 3.
PI = 5899.77
E = 2.949 kJ/mm
Difference less than 1%
DIP transfer MIG welding
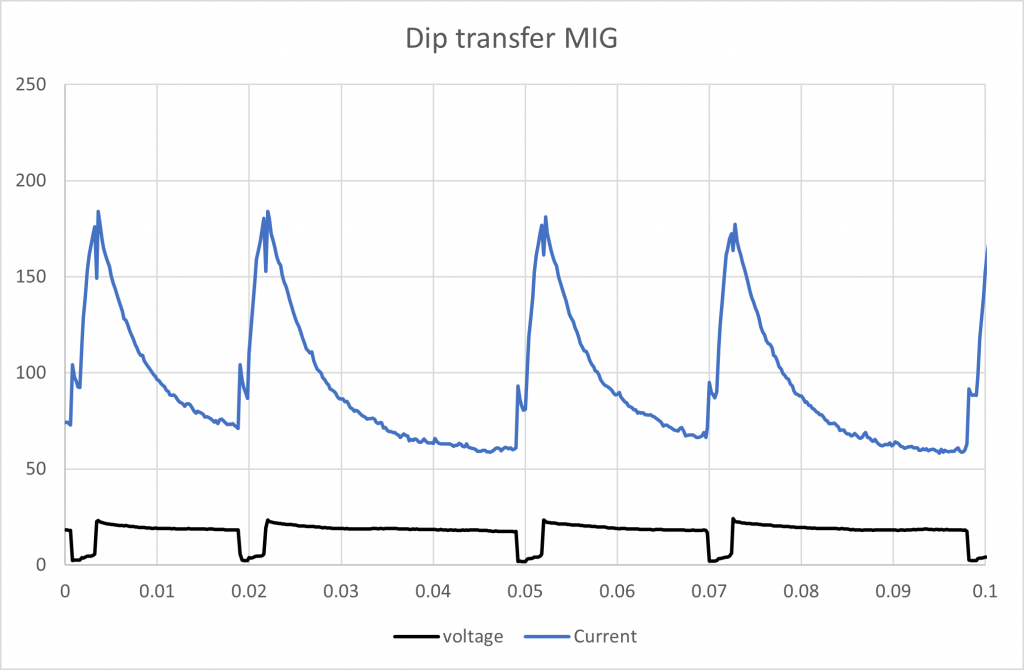
Figure 4 DIP transfer MIG 0.1 second
Method 1.
Average current: 97.2 A (averages based on 0.5 seconds of data)
Average voltage: 17.5 V
Say the welding is performed at 120 mm/min (2mm/s). Equation 1 is:
E = 0.851 kJ/mm
Method 2 and 3.
PI = 1699.1
E = 0.850 kJ/mm
Again, less than 1% difference.
Pulse MIG Welding
Pulse MIG welding is considered a controlled waveform power source.
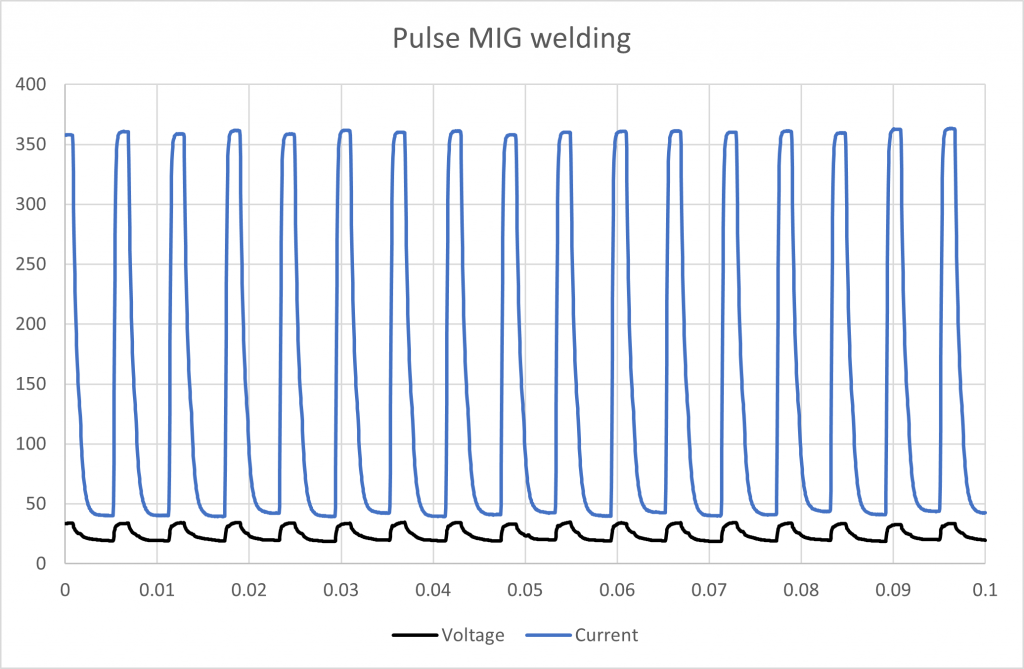
Figure 5Pulse MIG 01. Second
Method 1.
Average current: 147.8 A (averages based on 0.5 seconds of data)
Average voltage: 24.8 V
Say the welding is performed at 120 mm/min (2mm/s). Equation 1 is:
E = 1.833 kJ/mm
Method 2 and 3.
PI = 4375.3
E = 2.188 kJ/mm
Method 2 and 3 produces an arc energy 20% higher than Method 1.
Controlled DIP transfer
This is waveform that is controlled by the power source to minimise spatter and improve the welding process stability.
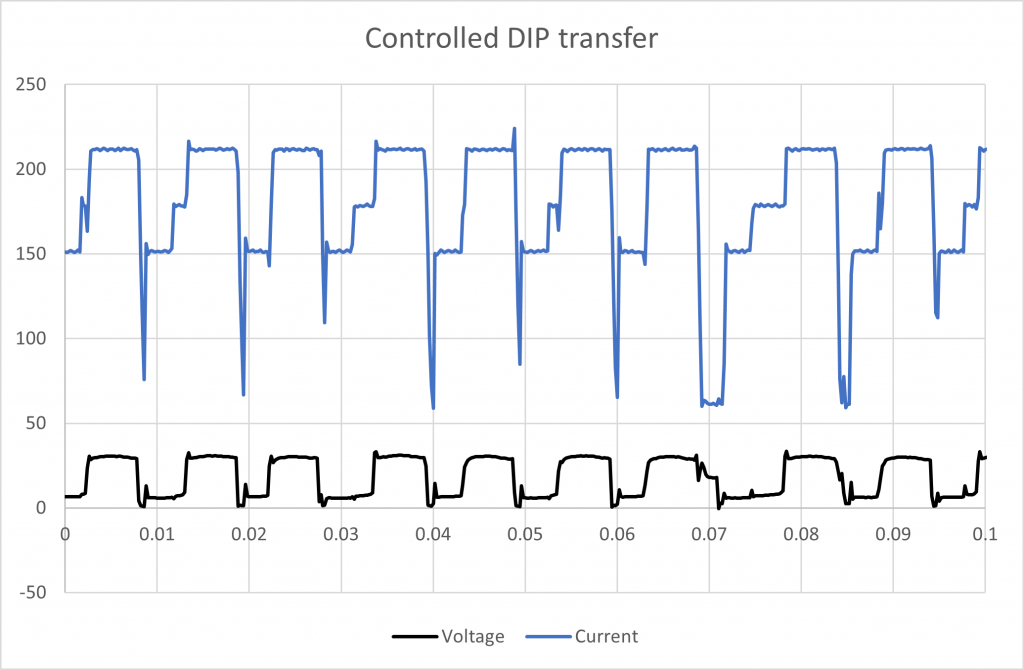
Figure 6 Controlled DIP transfer 0.1 second
Method 1.
Average current: 180.8 A (averages based on 0.5 seconds of data)
Average voltage: 18.9 V
Say the welding is performed at 120 mm/min (2mm/s). Equation 1 is:
E = 1.709 kJ/mm
Method 2 and 3.
PI = 3764.6
E = 1.882 kJ/mm
Method 2 and 3 produces an arc energy 10% higher than Method 1.
Summarising Arc Energy Calculation
Comparing the results
| Process | Method 1 | Method 2 &3 | Difference |
| DC TIG | 0.590 | 0.592 | 0.4% |
| Pulse TIG | 0.603 | 0.605 | 0.3% |
| Spray MIG | 2.955 | 2.949 | 0.2% |
| DIP MIG | 0.851 | 0.850 | 0.1% |
| Pulse MIG | 1.833 | 2.188 | 19.4% |
| Controlled DIP | 1.709 | 1.882 | 10.1% |
For pulse MIG and controlled DIP it is important to use a monitor capable of recording instantaneous power. All our welding monitors are capable of providing arc energy calcluations based on instantaneous power.